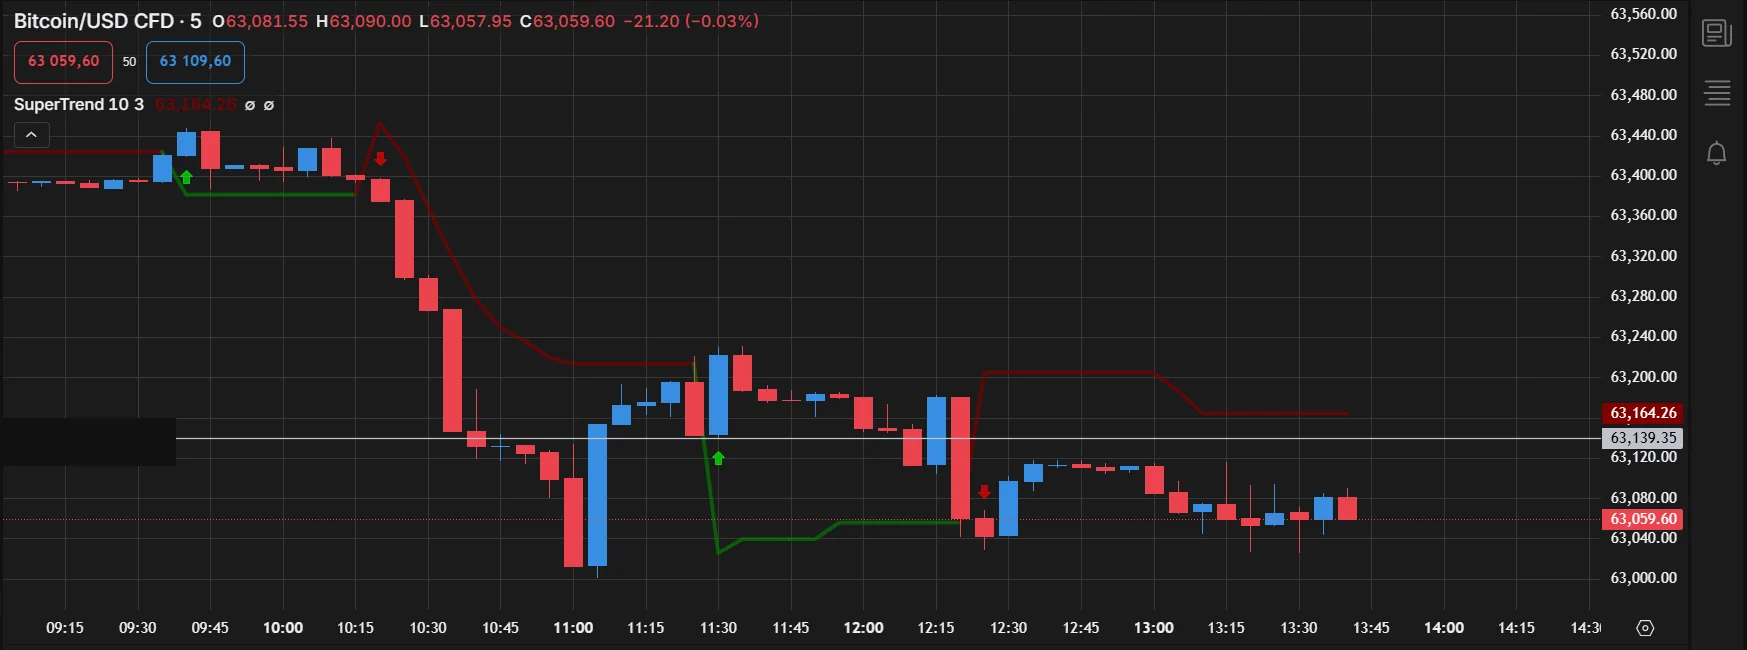
How transaction friction can erase a statistical signal, and why bot evaluation should measure edge after spread and realistic execution.
In plain English
This guide separates raw signal quality from real execution. Costs, timing and market friction can change the result even when the signal itself looks useful.
Price movement is not your net edge
A short-term signal may predict direction correctly and still lose if the expected move is smaller than spread, slippage and other costs. Evaluate the signal at the prices the bot can actually trade.
Measure in basis points
raw_move_bps = 10000 * (future_price - entry_mid) / entry_mid
spread_bps   = 10000 * (ask - bid) / mid
net_edge_bps = expected_move_bps - spread_bps - slippage_bps
The exact formula depends on direction and instrument, but the principle is consistent: costs must be included before claiming an edge.
Do not optimize on too few events
A threshold that performs well on a handful of signals may be noise. Track the number of events, days represented, drawdown, win rate, average/median outcome and sensitivity to small parameter changes.
Before you rely on this in production
- Spread/slippage assumptions are realistic.
- Performance is measured out of sample.
- Execution timing is included in evaluation.
- No historical result is presented as a guarantee.